
The “Risks” of an Election Year
When I started to draft this commentary in late September, my hometown Cincinnati Reds were in the playoffs and we had just witnessed the first presidential debate. Of course, in true 2020 fashion, we saw quite a turn with President Trump’s COVID-19 diagnosis and a quick playoff exit by the Reds in a series that was as brief as it was pitiful. While there will be no World Series trophy (yet again) this year, I want to highlight a few observations about the 2020 Reds before I dig into a more serious look at financial markets and the upcoming presidential election. Since the last playoff appearance in 2013, the entire Reds roster was revamped except for one player, two managers were fired, multiple front office personnel changes were made, heck, even the announcing crew turned over. None of this reduced my fandom one iota (nor does the most recent playoff loss). As Jerry Seinfeld says, “you’re rooting for clothes.” Varying team personalities, coaching strategies, and front office decisions are only relevant in terms of how they affect the stats that matter—how often are we getting on base, striking out, and hitting for power? How good is our starting pitching, bullpen, and defense? Ultimately, how frequently did we outscore the opponent? As long as the players are performing and the team is winning, the name on the back of the jersey doesn’t make much difference.
Politics is similar. Most Americans favor one political party over another. They’ll root for their preferred color, red or blue. And many will be disappointed by the outcome of an election, especially a presidential election. But focusing solely on red or blue can make it difficult to remember that, like sports, the characters are secondary to what truly matters—in any election, we should focus on policies, not politicians. With that in mind, this election preview will be data-heavy and prediction-free.
Potential policy changes that may impact the stock market
Of all the potential policy changes being discussed, changes in tax policy may have the greatest impact on your portfolio. Since every household’s tax situation is unique, consequences of individual tax policy are inevitably varied. Our Truepoint Talks webinar on September 23 included an analysis illustrating the impact of both candidates’ tax plans using five different “case studies.” But for this commentary, we’ll focus on the proposal that may have the most direct effect on the stock market—changes to the corporate tax structure. Joe Biden’s plan includes raising the top corporate tax rate from 21% to 28%. While this would be painful for companies, it probably isn’t catastrophic. Some historical context is useful in showing why:
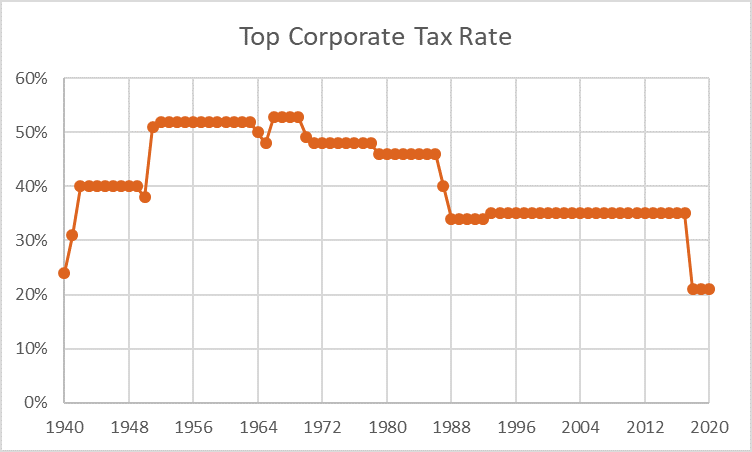
- The 7% increase would still leave the top rate below the 35% rate it was from 1993 – 2017.
- A top rate of 28% would still be the second-lowest rate since 1940.
- The last corporate tax hike was in August 1993 (from 34% to 35%). Corporations proved resilient, growing operating earnings 30% in 1993 and another 19% in 1994, according to J.P. Morgan.
Of course, Biden would need assistance from Congress to make this plan a reality, and history has shown that not all campaign promises materialize into enacted policy.
What history shows us about politics and investing
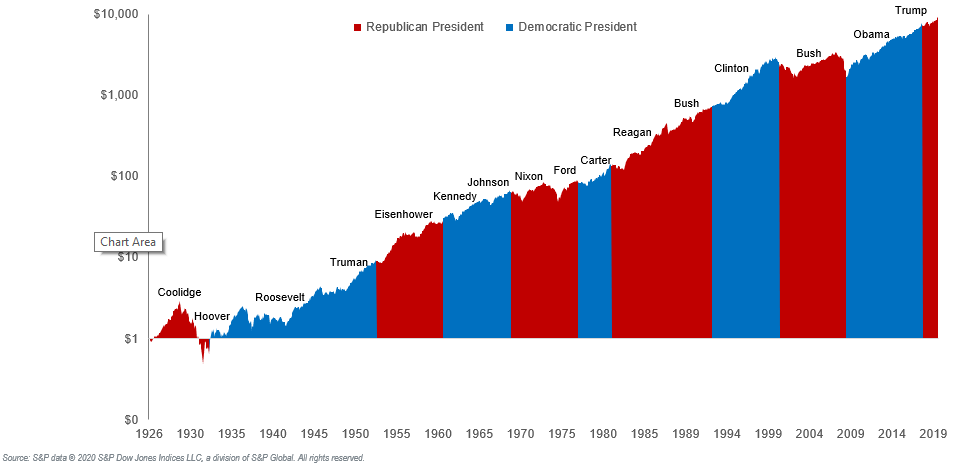
I wouldn’t go so far as to say the presidential election is an “all bark and no bite” event, but the bark is ear-splitting and it’s too early for a definitive prognosis on the bite. Predictions that a particular result will decimate your returns are both premature and hyperbolic. The truth is that stocks have gone up under the most liberal, as well as the most conservative, administrations:
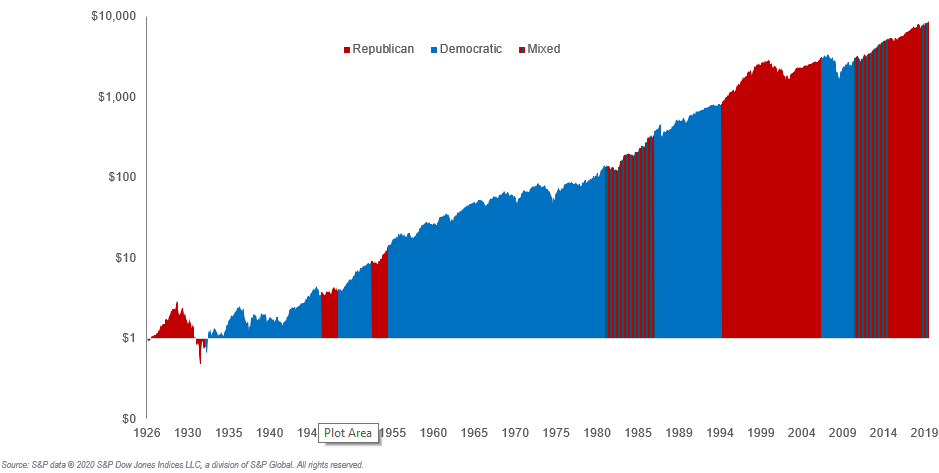
And it hasn’t mattered which party has controlled Congress either:
This isn’t so surprising when you realize that shareholders invest in companies, not political parties. And companies focus on serving their customers and growing their businesses, regardless of who is in the White House. Invesco’s chart below brilliantly depicts what would happen if you allowed partisan views to drive portfolio decisions:
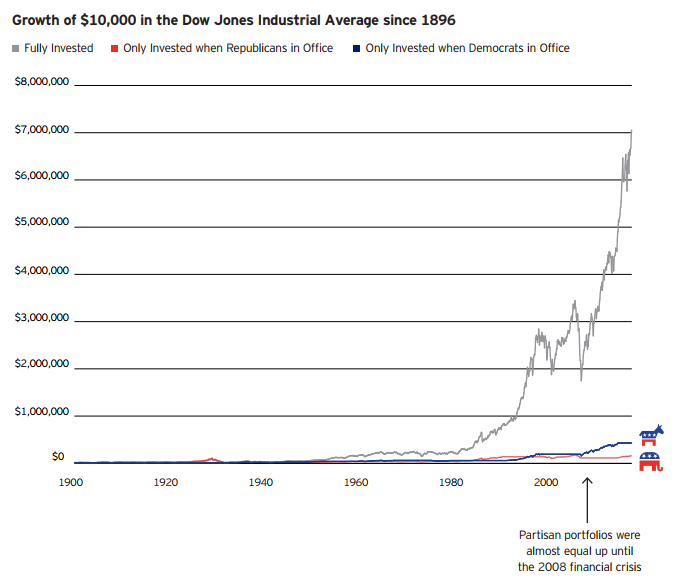
If you only kept your money in the markets when the party you favored controlled the White House, your returns would significantly trail those who stayed in the markets regardless of election results—and this holds true for both Republicans and Democrats alike. The data are clear: the more time spent participating in the markets, the better off you’ll be financially, regardless of politics.
Risk ≠ Volatility
I believe that “volatility” is the most overused word in stock market conversations. It’s frequently used interchangeably with “risk,” but in fact, “volatility” refers simply to variation around an average. While volatility is an attribute of market risk, other risks investors face include liquidity risk, longevity risk, and concentration risk. Nonetheless, volatility is the most cited reason to exit the stock market. The past few months reveal just how misguided this belief is.
Increased levels of volatility do not mean you have a greater chance of losing money. Over the past 30 years, global stocks (represented by the MSCI ACWI Total Return Index) have moved on average 0.7% a day, in absolute terms. (In other words, this is how much stocks moved each day, on average—regardless of whether that movement was positive or negative. So, if stocks returned +0.7% yesterday and then -0.7% today, their average daily move would be 0.7% in absolute terms, not 0%.)
COVID-19 made markets extremely volatile during the first half of this year. From late-February to late-March, the stock market’s average daily move was 3.3%, almost five times bigger than its long-term average. Put another way, a week’s worth of volatility happened every single day! As you know, most of this volatility was on the downside. Global stocks cratered 33%, and Great Depression comparisons were rampant. (If you don’t believe me, click any of these words for proof.)
During this time, I heard, “I’m going to wait this out until volatility subsides,” more than once. But volatility did not subside. It simply changed directions.
For the next five weeks—from the end of March until April 30—the stock market’s average daily move was 2%, about three times the long-term average. But during these five weeks, stocks gained 28%! The market was volatile, but in a way that benefited investors.
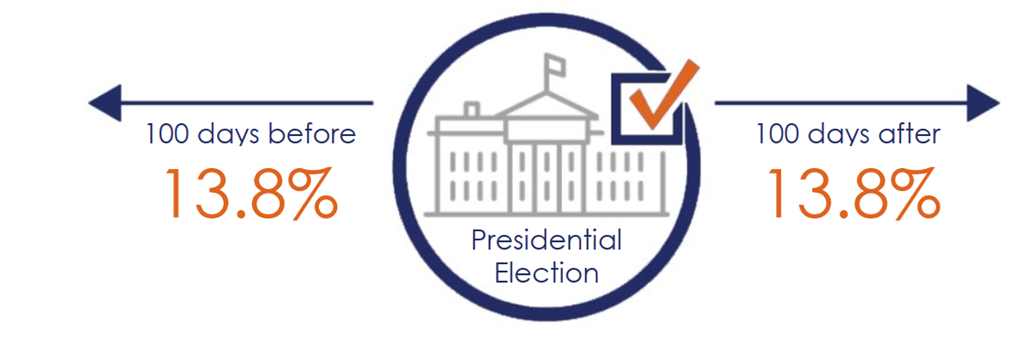
Volatility is one metric used to evaluate risk, but it’s a terrible one for individual investors to focus on. Even if you could forecast heightened periods of volatility (perhaps, for example, around an upcoming election), there’s no telling which way the market will move—or when it might whimsically change directions. Further, against all conventional wisdom, research from Vanguard has shown that going back to 1964, volatility has been lower in the 100 days before and after a presidential election, compared to an average year.
Annualized S&P 500 Index Volatility
Full time period: 15.7%
Rather than fretting about volatility, investors would do better to focus on the risk of permanent loss. And this risk is massive for those with concentrated portfolios of individual stocks. In fact, between 1983 and 2006, about one-in-five stocks lost at least 75% of their value, and most individual stocks had a worse return than cash. But if you hold a diversified portfolio, your greatest risk of permanent loss is you. A diversified portfolio has never experienced permanent loss, as every single decline in global stocks has proven temporary. Therefore, both types of risk discussed—volatility and risk of permanent loss—are only risks to the extent that they encourage investors to abandon their portfolios at the wrong time.
Investing is complicated because it’s inevitably emotional. It becomes immensely more complicated when you layer in another emotional topic—politics—into your investing process. As we’ve advised in the past, when you’re investing, you should file your political emotions away someplace safe, where they can do your investment portfolio no harm.