
Where the Market Stands: A Story in Three Charts
“Far more money has been lost by investors preparing for corrections or trying to anticipate corrections, than has been lost in corrections themselves.” — Peter Lynch
In the past few Januarys, when we’ve taken the opportunity to look back at “the year in investing,” the big news has been that there is no news. On the whole, the markets have hummed along with few disruptions.
This year, the overarching story is that volatility has returned and is making up for lost time. In fact, during December alone, the S&P 500 was up or down at least 1% nine times—a stark contrast to only eight moves of that size for the entirety of 2017. This volatility has partly been the result of geopolitical events, including U.S. mid-term elections, the turmoil surrounding Brexit and ongoing debates about tariffs. More recently, the U.S. government shutdown further heightened anxiety. On the economic front, increased Fed tightening and a rise in headline inflation—to about 2.5% year-over-year—have also stoked fears of a recession.
Yet, many of these shifts represent a return to historically normal levels rather than a definitive step toward economic doom. Corporate earnings, the labor market and the overall economy still appear relatively strong. Nevertheless, even small disappointments or surprises—such as unexpected earnings announcements—have caused noticeable aftershocks.
At Truepoint, we often discuss the value of historical data, quantitative metrics and rational decision-making. Our investment process does not rely on predictions, speculation or the “crystal ball” model of portfolio management. So, for this annual letter, we wanted to showcase three different data visualizations that provide important insights into our thinking about the current market environment.
A recession may be on the horizon, but the sky isn’t falling
On average, a recession happens about once every five years, and it’s been almost 10 years since the last one. So, another recession would not be unexpected—but exactly when it might occur, no one can say. If history is any guide, there will continue to be debate about when it will start, even long after it has already begun.
Despite some warning signs of an economic slowdown, several factors indicate a recession could be several years away.
- We’re not about to collapse under a pile of debt. Household finances are still healthy. Household outstanding debt is about 79% of GDP. It was 125% at its 2009 peak.
- Holiday retail sales were the strongest they have been in six years. From November 1 through the end of 2018, sales were up 5.1%, and online sales increased by 19%, according to Mastercard.
- The labor market is still showing signs of strength. Payrolls increased an average of 170,000 during the past three months, and wages rose 3.2% year over year.
- Interest rate hikes have become less of a risk. Fed chairman Jerome Powell has already dialed back plans for rate hikes in 2019, saying they will only occur in response to new data about economic strength.
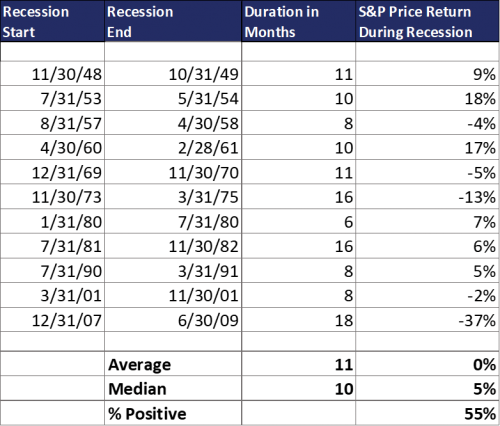
Nevertheless, many investors remain skittish. After all, the last recession was the Global Financial Crisis (GFC), an experience that won’t soon be forgotten. But historical data indicates that the next recession will likely be far less severe. Since the late 1940s, the U.S. has endured 11 recessions, each one lasting an average of 11 months. Importantly, the average return of the S&P 500 during those recessions was 0%, and that’s excluding dividends. But much can be hidden in these metrics. For example, during the GFC (2008-2009), the S&P 500 dropped 37%, but during other recessions, the market actually rose. In fact, in six of the past eleven recessions the S&P 500 actually rose.
Even if a recession does occur sooner than expected, we will not respond with fear, shock or a reactive mindset. At Truepoint, we anticipate and plan for recessions as part of our investment process. Although down markets are never pleasant, they are an inherent part of the economic cycle. Rather than adopting a “Chicken Little” mindset when the tides turn, we rely on our consistent, data-driven investment process to help navigate our clients through turbulent times.
Seeing the big picture in stock valuations
Though the market has become more volatile during the past year, stock valuations suggest additional opportunities for continued growth.
Currently, the S&P 500 Index is trading at about 14 times expected 2019 earnings of $178 per share, which falls below the average of about 16.2 times over the past 50 years. By itself, this is sufficient to suggest stocks are attractive. Yet this valuation is actually skewed upwards by a few very large, rapidly growing firms that enjoy dramatically stronger valuations than the average.
Excluding Facebook, Amazon, Netflix, Google-parent Alphabet and Microsoft, the remaining 495 stocks in the S&P 500 are priced at less than 13 times expected 2019 earnings. And that’s not the only positive sign for investors. The price/earnings (P/E) multiple for the stock market is inversely related to interest rates—lower interest rates typically produce higher stock values. With rates still at historically low levels, stock multiples should be above historical averages. When inflation has hovered around two percent historically, the average P/E multiple has been about 19 times earnings.
The scatterplot chart below underscores the connection between valuations and market returns. Here you can see the relationship between the forward P/E multiple (on the x-axis) and stock returns (y-axis) over a five-year period. As evidenced by the trendline, lower P/E levels (more attractive valuations) are a fairly good predictor of higher returns, especially over the long term.
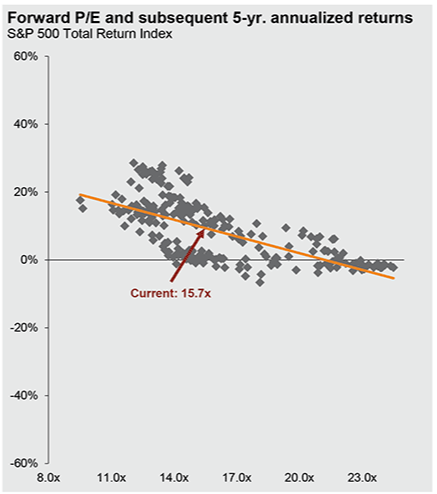
Thus, even with the prospect of an economic recession or continued volatility, there is ample evidence that U.S. stocks will continue to reward investors over the long term.
The pilot has turned on the fasten seat belt sign
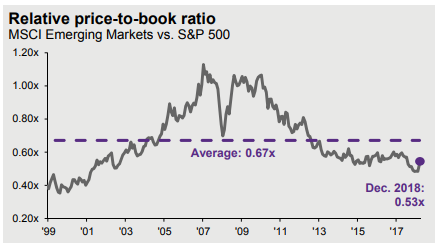
While we see the attractiveness of U.S. stocks, we see even more opportunity within Emerging Markets (EM). EM stocks were the worst performing asset class over the past year and their valuations dropped 16%, which makes EM stocks the cheapest they’ve been in 15 years relative to their U.S. counterparts (see graph below).
That said, the EM asset class is diverse and evolving; as a result, it is typically more volatile than U.S. markets. We anticipate trade negotiations to be a continued theme and source of volatility throughout 2019, and as such, we expect that the ride will continue to be bumpy. However, with low valuations, high revenue growth and higher dividend yields, EM stocks appear very attractive.
Keep Calm, and Carry On
Although we see encouraging signs in global markets, our investment process seeks to make the most of market downturns when they do occur. Our investment team has been working diligently to rebalance and tax-loss harvest portfolios since volatility picked up in the final few months of the year and we will continue to take advantage of the volatility. In short, we believe our investment process can capitalize on the turbulence.
We continue to monitor data like we’ve walked you through above, but we do not claim to have any special insights about what will happen over the next quarter—or even the next year. However, we think it’s important to share some of the facts we find intriguing in order to help you understand why we see long-term opportunity in the market, despite the volatility and hand-wringing headlines.