
What Does Checking Facebook Have to Do with Your Investments?
We all know that social media doesn’t reveal a complete picture of our friends’ lives. After all, their timelines are filled with only the most beautiful vacation photos and the best stories of their children’s celebrated achievements.
Even still, research indicates that we can’t help but compare our lives to others when we visit social media sites. We see the amazing photos of our friends and wonder, “Why aren’t I doing that? What else could I be missing out on?”
This phenomenon has become known as “fear of missing out”—or FOMO, for short. It causes us to get stuck in a cycle of checking social media again and again so that we don’t feel out of the loop. We want reassurance that, compared to our friends, we are, in fact, doing okay.
You may be surprised to learn that the investment community has its own version of FOMO—though our term isn’t nearly as catchy. We call it “frame-of-reference risk,” a term coined by asset allocation guru Roger Gibson. He showed that investors tend to evaluate their portfolio relative to the returns of the major market indexes—especially the S&P 500.
When the S&P 500 is performing very well but investors’ more diversified portfolios are struggling, people experience something very similar to FOMO. They feel dejected about their portfolio and fear that they are missing out on all of the good returns. They may even decide to sell off their diversified portfolio and go all in on the S&P 500—often right as market dynamics are beginning to shift, unfortunately.
That’s why this is called frame-of-reference risk: the risk is that investors will abandon their diversified portfolios and buy into the S&P 500 right at the wrong moment. In other words, they engage in classic “buy high, sell low” behaviors.
Today’s market is ripe for such “frame-of-reference risk” decisions, and we understand that our clients are not immune. After all, diversified portfolios have not performed as well as the S&P 500 recently, due to several trends, including:
- Value stocks underperforming growth stocks
- Poor performance in emerging markets
- The dominance of just a handful of stocks
Value has underperformed growth
So far in 2018, value stocks—those stocks that appear to trade at a discount, based on various financial metrics— have significantly underperformed growth stocks—those stocks that appear to have substantial potential for growth, according to certain key measures. Through September of this year, the Russell 1000 Value Index has returned 3.9%, while the Russell 1000 Growth Index has more than tripled that, returning 17.1%.
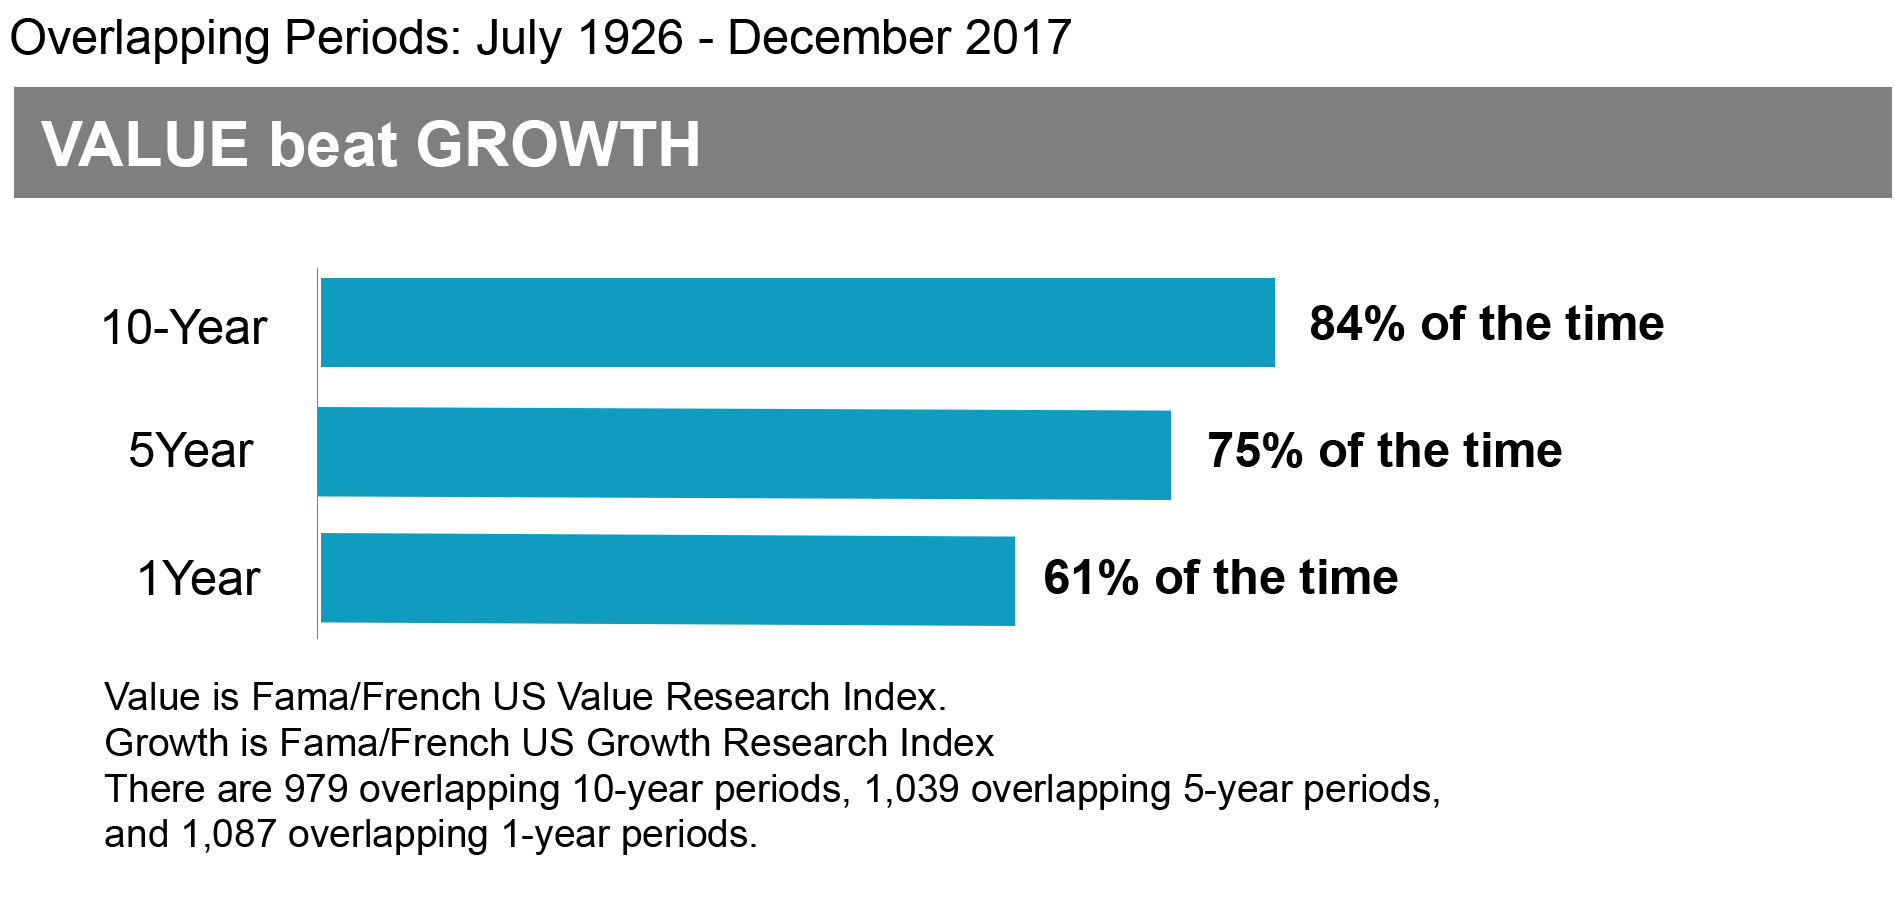
Although growth stocks do beat value stocks on occasion, over the long term, value stocks have consistently outperformed growth stocks—a pattern that financial professionals have dubbed “the value premium.” The chart below illustrates this value premium: it shows the percentage of time that value has outperformed growth, using rolling 10-year, 5-year, and 1-year intervals. From July 1926 through December 2017, for example, U.S. value stocks outperformed U.S. growth stocks 84% of all 10-year rolling time periods.
The value premium is both persistent and pervasive, meaning it appears throughout history and across sectors and countries. In addition, this strong performance is evident across various financial measurements of value, including price-to-book, price-to-earnings, and price-to-sales ratios. Because value stocks consistently outperform growth stocks over the long term, we maintain a tilt toward value stocks in our portfolio.
The S&P 500, on the other hand, is currently weighted toward growth stocks. Therefore, when growth performs well, so does the S&P 500, while our portfolio—with its tilt toward value—trails. As we discussed in our previous Viewpoint, the outperformance of value or growth stocks is an ongoing cycle, but history has shown us that value stocks prevail over the long term.
Poor performance in emerging markets
So far in 2018, the S&P 500 has returned around 10%, while the MSCI Emerging Market Index has fallen around 9%.
This kind of underperformance is nothing new for emerging markets. In fact, emerging market stocks have experienced a bear market (a selloff of 20% or greater) every other year, on average, since 1994. During that same time, the S&P 500 has only experienced a bear market in one of every six years, on average. If you include market corrections (a selloff of 10% or greater) in the calculations, then downturns in emerging markets equities outnumber downturns in the S&P 500 at the rate of about two-to-one!
It’s easy to understand why an asset class with so many slumps could leave investors longing for the more stable—and positive—returns of the S&P 500. So, why bother owning this asset class at all?
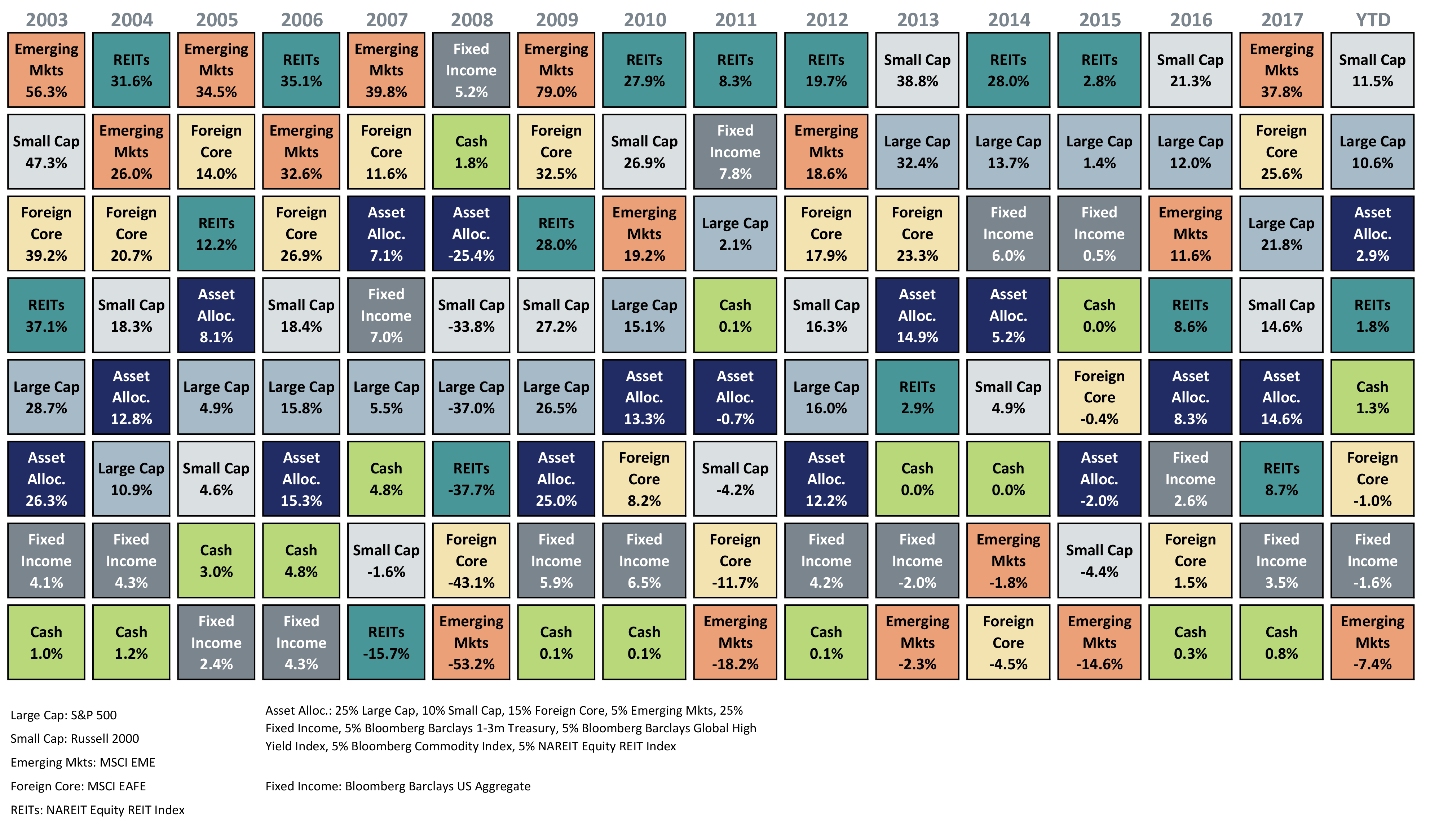
There are two reasons to own emerging market equities. One, the volatility of this asset class can cut both ways. Last year, emerging markets generated incredibly strong returns. The MSCI Emerging Market Index returned 37.8%, compared to 21.8% for the S&P 500 during 2017. Looking at the distribution of asset class returns below, you can see that emerging markets were the best performing asset class during several different individual years. In those years, if you held only the S&P 500, you would have missed out on a significant source of returns.
Because no one can predict which asset classes will outperform during a given year, we maintain a small, but consistent, allocation to emerging markets in our portfolio. This enables us to benefit in years when emerging markets do very well, and it prevents our portfolio from suffering too greatly when emerging markets experience one of their frequent downturns.
The other reason to hold this asset class is because it is not strongly correlated to U.S. equities. To create a diversified portfolio, you don’t want to invest in asset classes that all go up and down together. That defeats the purpose. But because emerging market equities are not strongly correlated to U.S. equities, they can help buffer our portfolios against U.S. market downturns—and provide an opportunity to rebalance the portfolio as a way to increase returns and lower the portfolio’s overall risk.
The same U.S. stocks are dominating returns
The S&P 500 is a market-weighted index, which means that the largest of the large companies have the greatest influence on its performance. Just a handful of stocks, therefore, can generate a significant portion of the S&P 500’s returns.
In recent years, that handful of stocks has been the collective known as FAANG—Facebook, Amazon, Apple, Netflix, and Google (also known as Alphabet, but FAANA doesn’t sound as cool). The dominance of only a few U.S. stocks is not a new phenomenon, however. In fact, just five stocks—Exxon Mobil, Apple, General Electric, Microsoft, and IBM—accounted for 10% of all U.S. equity market returns from 1926 through 2016. Owning those stocks generated robust returns during that time. But how many of us would have wanted to own GE from 2016 through 2018? Again, because no one can predict the precise ups-and-downs of individual stocks, we opt for a more diversified portfolio.
So, the next time you’re hitting refresh to view up-to-the-minute S&P 500 returns, remind yourself of the financial world’s version of FOMO. Frame-of-reference risk is an illustrative concept because it explains how our emotional response to past returns affects our future investment decisions. It reminds us that this response is human and universal—just like checking social media again and again.
To succeed in investing, you need to break free of these emotional cycles. This is why our allocation strategy at Truepoint has remained consistent for years; it is driven by academic research and rational decision-making, rather than short-term distractions and a fear of missing out!
The Russell 1000 Value Index is a subset of the securities found in the Russell 1000 based on a “probability” of value as measured by their relative book-to-price (B/P) ratio. The Russell 1000 Growth Index is a subset of the securities found in the Russell 1000 Index based on a “probability” of growth as measured by their Institutional Brokers’ Estimate System (I/B/E/S) forecast of medium-term growth (2 year), and sales per share historical growth (5 year). The Standard & Poor’s 500 Index (S&P 500) is a market-capitalization-weighted index of the 500 largest U.S. publicly traded companies by market value. The MSCI Emerging Markets Index measures equity market performance in global emerging markets. It consists of 23 economies and is a float-adjusted market capitalization index.