
How to Evaluate Investment Performance
One topic we find to be a frequent source of confusion among investors is performance evaluation. In other words, how should an investor judge the success (or lack thereof) of their portfolio?
Many simply gauge performance by changes in the dollar value of the portfolio; however, this approach does not properly account for the impact of investor contributions and/or withdrawals. Others correctly focus on investment returns net of any contribution or withdrawal activity, but fail to compare the performance against a properly matched independent benchmark.
How should one measure investment performance?
When evaluating investment performance, two basic measures hold the most importance – absolute return and relative return.
Absolute return* is simply the return (net of any investor contributions or withdrawals) generated in your portfolio over a given time frame. Ultimately, absolute return determines the investor’s ability to reach their long-term financial objectives. However, absolute return does not tell us how effectively the portfolio is capturing the returns generated by the financial markets – thus the importance of relative return. The relative return is calculated by comparing the absolute return of the portfolio to that of an appropriate benchmark.
What constitutes an appropriate benchmark?
Many investors benchmark their portfolio to stock indices frequently cited by the media, such as the S&P 500, Dow Jones Industrials Average Composite or Nasdaq. Of these, only the S&P 500 is broad enough to provide a relevant benchmark for U.S. stocks; however, it does not represent an appropriate gauge for a balanced portfolio that includes bonds and other asset classes such as foreign stocks or real estate. Rather, a portfolio’s benchmark should mirror the strategic allocation of the portfolio.
For example, if U.S. stocks represent 40% of a portfolio’s allocation, the portfolio’s composite benchmark should include a 40% weighting to a U.S. stock benchmark. Constructing a benchmark in this manner allows for a true “apples-to-apples” performance comparison.
How is the benchmark constructed for a typical Truepoint portfolio?
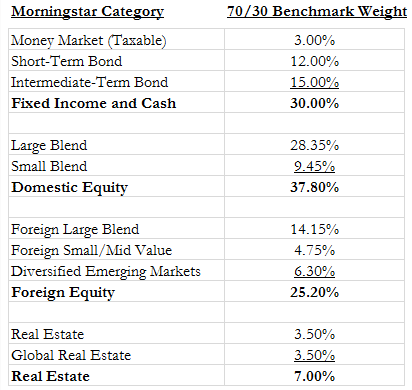
In order to appropriately match strategic portfolio allocations, most benchmarks constructed for Truepoint client portfolios weight the returns of ten investment categories (calculated by Morningstar). The table below details the benchmark composition of a typical Truepoint-managed 70/30 portfolio.
What does the relative result tell me?
Addressing this question starts with distinguishing the controllable factors in investing from the uncontrollable. Within an investor’s control are expenses, portfolio allocation and rebalancing activity. Unfortunately, the returns generated by the financial markets are uncontrollable – no investment manager can create returns, they simply are charged with capturing returns effectively.
For example, an actively managed strategy selects individual stocks and/or times the market in an attempt to capture only the most positive returns. In contrast, a passively managed strategy simply attempts to consistently capture the aggregate return of a large number of stocks. (Despite the intuitive appeal of the active approach, industry results show most actively managed strategies have historically underperformed a comparable passive strategy.)
While absolute returns are primarily driven by financial market performance (an uncontrollable factor), relative returns are more reflective of the effectiveness with which the portfolio has captured those market returns. Portfolio returns approximating to exceeding the benchmark return typically indicate an effective portfolio. However, while it is obvious that significantly trailing the benchmark should raise a red flag, the same is also true of returns significantly exceeding benchmark results.
When portfolio performance deviates substantially from the benchmark, there are usually two possible explanations: 1) the benchmark is not properly matched to the portfolio, or 2) the level of risk being taken in the portfolio is so high that it has produced an extreme outcome (positive or negative). Investors experiencing an extreme positive outcome should recognize the potential for a similarly negative result.
Given the buy, hold and rebalance philosophy underlying our investment approach, it is very unusual for our client portfolios to outperform or underperform significantly in any given year. Over time, the consistency of this approach has created a long-term performance track record which compares very favorably relative to portfolio benchmarks and our peers.
The bottom line
While over the long run investors should be concerned with building and/or preserving wealth through absolute returns, relative return can help investors evaluate how effectively they are capturing market returns. Any investor consistently underperforming a benchmark, as long as the benchmark is deemed to be appropriate, should evaluate the soundness of their strategy and the efficiency of its implementation.
*Absolute return is indicated on Truepoint’s quarterly reports as “Time Weighted”